Scroll:Data and graphs >> Making graphs >> mcq (3773)
Written Instructions:
For each Multiple Choice Question (MCQ), four options are given. One of them is the correct answer. Make your choice (1,2,3 or 4). Write your answers in the brackets provided..
For each Short Answer Question(SAQ) and Long Answer Question(LAQ), write your answers in the blanks provided.
Leave your answers in the simplest form or correct to two decimal places.
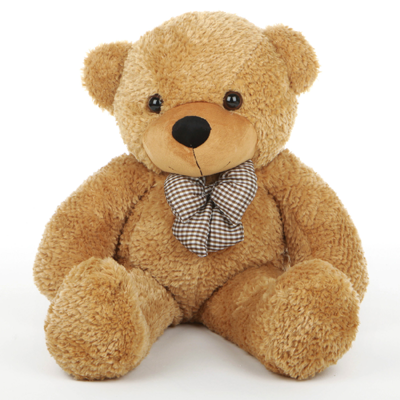
| 1) Look at the picture.
Which graph shows the number of Giraffe and Toy
( ) |


| 2) Look at the picture.
Which graph shows the number of Car and Bear
( ) |


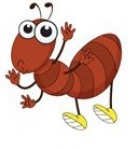
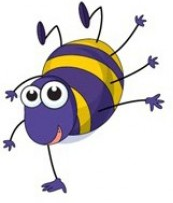
| 3) Look at the picture.
Which graph shows the number of Ups and Insect
( ) |

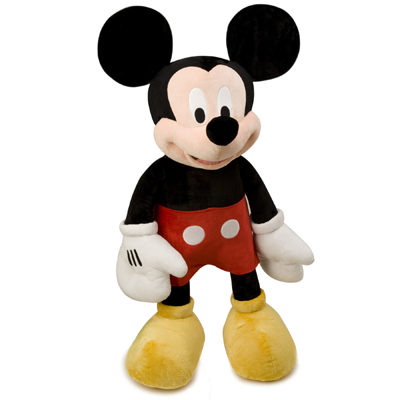
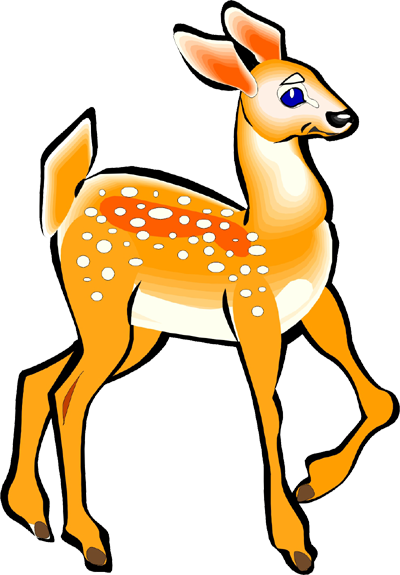
| 4) Look at the picture.
Which graph shows the number of Deer and Toy
( ) |

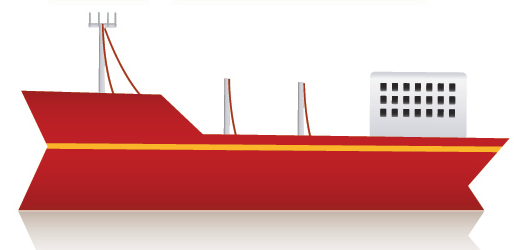
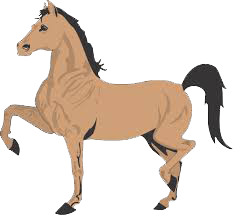
| 5) Look at the picture.
Which graph shows the number of Ship and Horse
( ) |
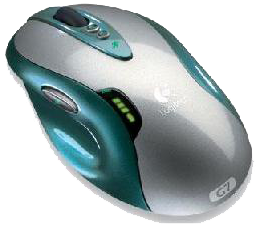
| 6) Look at the picture.
Which graph shows the number of Mouse and Insect
( ) |
| 7) Look at the picture.
Which graph shows the number of Big-zebra and Toy
( ) |

| 8) Look at the picture.
Which graph shows the number of Car and Bear
( ) |

| 9) Look at the picture.
Which graph shows the number of Speaker and Insect
( ) |

| 10) Look at the picture.
Which graph shows the number of Zebra and Toy
( ) |

| 1) Look at the picture.
Which graph shows the number of Giraffe and Toy
Answer: 1 SOLUTION 1 : First, count the Giraffes.
|
| 2) Look at the picture.
Which graph shows the number of Car and Bear
Answer: 2 SOLUTION 1 : First, count the Cars.
|
| 3) Look at the picture.
Which graph shows the number of Ups and Insect
Answer: 2 SOLUTION 1 : First, count the Upss.
|
| 4) Look at the picture.
Which graph shows the number of Deer and Toy
Answer: 1 SOLUTION 1 : First, count the Deers.
|
| 5) Look at the picture.
Which graph shows the number of Ship and Horse
Answer: 2 SOLUTION 1 : First, count the Ships.
|
| 6) Look at the picture.
Which graph shows the number of Mouse and Insect
Answer: 2 SOLUTION 1 : First, count the Mouses.
|
| 7) Look at the picture.
Which graph shows the number of Big-zebra and Toy
Answer: 2 SOLUTION 1 : First, count the Big-zebras.
|
| 8) Look at the picture.
Which graph shows the number of Car and Bear
Answer: 1 SOLUTION 1 : First, count the Cars.
|
| 9) Look at the picture.
Which graph shows the number of Speaker and Insect
Answer: 1 SOLUTION 1 : First, count the Speakers.
|
| 10) Look at the picture.
Which graph shows the number of Zebra and Toy
Answer: 1 SOLUTION 1 : First, count the Zebras.
|